3rd grade math activities

The paper airplane line plot rebuilt so 3rd graders measure for a real lane, five more activities by standard, a free printable, and the standards each one teaches.

Who we are. Mission.io makes Missions: teacher-led, whole-class simulations where students use what they’re learning to work through a real scenario together.

Everything on this page works without us. The standards this page teaches are at the end, with a Mission where one exists, free. (There are three. In Dug’s Great Big Garden, Dug’s greenhouses on Areva stay empty until the crew gets its fractions right. Nobody asks the PE teacher.)

On this page

What 3rd grade math looks like

Third grade math activities are problems where the class has to use the math to decide something, argue about whether the numbers are right, and leave each student answerable for a piece. This page teaches 12 of the 25 3rd grade Common Core math standards, with an activity for six of them and a Mission for nine.

The year has four big jobs. Multiplying and dividing within 100 (3.OA). Fractions, unit fractions first, in a domain that starts this year (3.NF). Area, and how it connects to multiplying (3.MD.C). And two-dimensional shapes. Around them sit rounding and adding within 1000 (3.NBT), time, liquid volume, and mass (3.MD.A), graphs and line plots (3.MD.B), and perimeter.

You know the activity that usually stands in for line plots. Everyone folds a plane, everyone throws, one kid draws the plot, and the plot exists because the standard says so. That’s a throwing contest with a chart. Hand the plot to a PE teacher who has to mark off a lane from it, and now it has to be right.

Six things that turn an exercise into math

Math isn’t short on time: grades 3 to 5 average about 63 minutes a day on it (2018 NSSME+). It’s short on talk. Observers in more than 2,500 first, third, and fifth grade classrooms found about 90% of instructional time was whole-group lecture or seatwork, and under 10% was small groups (Pianta and colleagues, 2007). That’s the gap worth closing, because cooperative learning beat whole-class instruction on achievement, and the effect was stronger in science and math than in social sciences and languages (Kyndt and colleagues, 2013).

  1. 1. A real problem with stakes the class can feel.

    “Make a line plot” is an exercise. “The PE teacher needs to know how long the lane has to be” is a problem.

  2. 2. Apply, don't recall.

    A second round with one fold changed, so the class has to read two plots against each other. If the plot can be finished without anyone reading it, it isn’t a math activity.

  3. 3. Group goals with individual accountability.

    The one most data projects miss: everyone throws, one kid plots. When the group shared a goal and each student answered for a part, 84% of studies found a positive effect; without both, 17% (Slavin, 1991).

  4. 4. The teacher leads the thinking.

    Three questions at the tape (show me the quarter mark, where does this one go, what does the plot say) beat a worksheet of twenty at the desk.

  5. 5. A debrief where the class argues it out.

    The throwing is the setup. The argument afterward, about whether a flight belongs on the half mark or the nearest quarter, is the practice the standards name: construct viable arguments and critique the reasoning of others (MP3).

  6. 6. A way to see who did what.

    If you can’t tell which student read the tape and which one only threw, you can’t teach the measuring. You can only collect the plot.

One flight proves nothing. Thirty settle the argument.

The sheet at the end of the next section puts all six on the throw line: role cards, the flight log, two line plots, and the tally. Get the sheet →

Paper airplanes, rebuilt for 3rd grade (3.MD.B.4)

Students fold planes, throw them, measure each flight to the nearest quarter inch, and put the class’s data on a line plot. It’s the lesson 3.MD.B.4 produces in curriculum after curriculum, because 3rd grade owns the line plot with fractions and the airplane supplies the data. The way it usually runs is everyone throwing, one kid plotting, and a plot made because the standard says so. Here’s the version that hits all six.

Time
50 minutes. The 45-minute cut: one plane design per team, pre-folded from one template, six flights per team in round one, and round two as a single redesign and four flights.
Groups
Fours. With 27 students, six groups of four and one of three, where the Checker also plots.
Supplies
Copy paper, 7 tape measures or yardsticks laid end to end (a 25-foot tape per team is ideal, about $5 each), masking tape for the throw line, and the plot sheets. About $10 if tapes are bought.
Standards
3.MD.B.4 (measure lengths with rulers marked in halves and fourths of an inch, and show the data on a line plot marked in whole numbers, halves, or quarters), with the practices MP6 (attend to precision: the quarter-inch mark) and MP3 (argue from the plot).
  1. Teach first, 10 minutesApply

    Throw one plane, lay a tape measure along the floor, and ask the class to read the landing spot. Argue the quarter inch out loud. Name the rules: measure from the line to the nose, read to the nearest quarter inch, and one X on the plot is one flight. Then show a blank line plot with the quarters marked.

  2. The problemStakes

    The school’s paper airplane day is coming, and the PE teacher needs to know how long the gym lane has to be for 3rd grade planes, so nobody hits the wall. One guess isn’t evidence. The class delivers a line plot of 30 or more flights and one sentence: “Most planes land between ___ and ___, and the longest was ___.”

  3. Four roles, one job eachAccountability

    Everyone signs their role’s box. Rotate the Pilot every throw, so everyone throws twice.

    • Pilot

      One fold design, throws from the line, the same stance every time.

    • Measurer

      Reads to the nearest quarter inch, and says it aloud: "forty-two and three-quarters."

    • Checker

      Re-reads the tape before the plane is picked up, and says "agree" or "no."

    • Plotter

      Puts the X on the team plot, and carries the team's data to the class plot.

  4. You lead the thinkingTeacher leads

    Three questions, at the tape: Show me the quarter mark you read. Where on your plot does this one go, and why that spot? What does your plot say most planes do? The hard part is letting the Checker say “no” before you do.

  5. Two rounds, so the plot has to be readApply

    Round one is eight flights, two per student, on the team plot. Then the team changes one fold, its own choice, and flies eight more onto a second plot. Now there are two plots to compare at the debrief.

  6. The debrief, 10 minutesDebrief

    The class plot, built from every team’s Xs. Where’s the cluster, and what’s the longest flight? Did the redesign shift the cluster, and how do you know from the plot? What lane length would you tell the PE teacher, and what on the plot is your evidence? Who in your group caught a misread quarter? Third graders will argue about whether 36 and a half belongs on the half mark or the nearest quarter, and that argument is the standard.

  7. See who did whatSee who did what

    The observation sheet, four behaviors per student: read a measurement to the nearest quarter inch, placed an X correctly, disagreed about a reading with a reason, used the plot to make a claim. Tally while you walk; you’ll catch about half the room. The throwing lanes queue, and the queue is when you check readings.

(The PE teacher asked for a lane, so even the plane that loops behind the line goes on the plot. What number it gets is the class’s call.)

Tape the throw line down before anyone folds anything. A line that isn’t taped moves every time someone wants a longer flight.

The paper airplane line plot, free

Emailed now, ready to copy: the teacher page, the Pilot, Measurer, Checker, and Plotter role cards, the flight log with the PE teacher’s sentence, the plane to start with, two blank line plots, and the four-behavior tally.

It’s on its way.

Check your inbox for the paper airplane line plot.

Email me the sheet. It comes as a PDF, ready to print. Unsubscribe anytime.

Five more 3rd grade math activities, by standard

Five more on every 3rd grade list: what each one is, how it usually runs, and what it needs to be a math activity, in the order the standards run.

Multiplying, fractions, time, graphs, area

2. Multiplication arrays with cereal (3.OA.A.1)

Needs a cup of cereal, a paper plate.

Children get a cup of cereal and a paper plate, lay the pieces out in rows, four rows of six, and write the multiplication equation for each array. It’s real multiplication as equal groups, and the snack at the end doesn’t hurt. As usually run, though, each child builds alone, the cereal gets eaten before anyone compares arrays, and you can’t tell who sees 4 times 6 and who counted every piece.

The fix

  1. Pair children: one builds the array, the other writes the equation, and then they swap.
  2. Before anyone eats, have each pair find two different arrays for the same number, like 24, and hold them up.
  3. Spend five minutes on why 4 rows of 6 and 6 rows of 4 make the same total, and listen for who can explain it.

No page for this one; row 7 below is a Mission on this standard.
3. Fraction strips or fraction pizza (3.NF.A.1)

Needs paper strips to fold, or paper circles. Cut-and-paste.

Children fold paper strips into halves, fourths, and eighths, label each part, and paste the strips in a column, or cut paper pizzas into slices. The folding is the math, since a child who folds a fourth can see it’s one of four equal parts. As usually run, though, it’s a cut-and-paste with no question behind it, and a pasted column can’t show which child understands that the parts have to be equal.

The fix

  1. Pair children, and make the Folder the only one who folds and holds up each strip.
  2. The Namer says what each part is, one fourth, and how many make the whole, before anything gets labeled. Swap on the next strip.

No page for this one; row 8 below is the Mission on this standard.

4. The telling time scavenger hunt (3.MD.A.1)

Needs clock cards hidden around the room.

Clock cards are hidden around the room, and children race to find each one, read it to the nearest minute, and write the time on a sheet. Kids love the hunt, and every clock is real reading practice. As usually run, though, it’s a race with nothing to figure out, the fastest finder fills in the sheet for the group, and you can’t tell who read the clocks.

The fix

  1. Make the clocks a school day out of order, so pairs have to read every one to put the day back together.
  2. Give pairs two jobs: one finds the clock and reads it aloud, the other checks it and writes it, and they swap at every clock.
  3. Have each pair work out how long one part of the day lasts, from one clock to the next, and show you how.

No page for this one; the three misses are the fix.

5. The class survey bar graph (3.MD.B.3)

Needs chart paper, a survey question. Whole class.

The class answers a survey question, you tally the answers on chart paper, and the class builds a scaled bar graph where each square stands for two votes. The data is the class’s own, and you’re leading the questions about how many more and how many fewer. As usually run, though, the whole class builds and reads one graph, so a few hands answer everything, and you can’t tell who reads a scaled graph alone.

The fix

  1. Have small groups graph the same survey data on their own chart, with one student drawing bars and one checking the scale.
  2. Give each student a two-step question to answer from their group’s graph, and collect the answers.

No page for this one; row 9 below is the Mission on this standard.

6. Area and perimeter with tiles (3.MD.C.7)

Needs square tiles. A station.

At a station, children build rectangles out of square tiles, count the squares inside for area, and count the edges around for perimeter. The tiles make the difference between the two visible, which is the hard part of the standard. As usually run, though, there’s no reason to build any one rectangle, one child does the counting, and you can’t tell who could find the area without counting every tile.

The fix

  1. Give it a reason, like a garden bed that has to cover exactly 24 squares, and ask which rectangle needs the least fence.
  2. Split the jobs: one child builds, one finds the area by multiplying rows by columns, one counts the perimeter, and they switch every rectangle.
  3. Have each child write one rectangle’s area as a multiplication on a card with their name.

See the zoo rebuilt for 4th grade →

  • Our part · We make Missions

    Then the unit has somewhere to go

    Plenty of teachers rebuild these by hand every unit, and it works. A Mission is a teacher-led, whole-class simulation built from a unit you teach. The plane is a line plot (3.MD.B.4), and no Mission carries that code. Fraction strips teach unit fractions (3.NF.A.1), and Dug’s Great Big Garden is built on them. After the fraction strips, run Dug’s Great Big Garden.

    You're at the helm, not on the hook.

    Dug's Great Big Garden: fractions, as a Mission

    Dug's Great Big Garden · 3rd grade · About 28 minutes · One device per student, plus your projector · Free with a teacher account

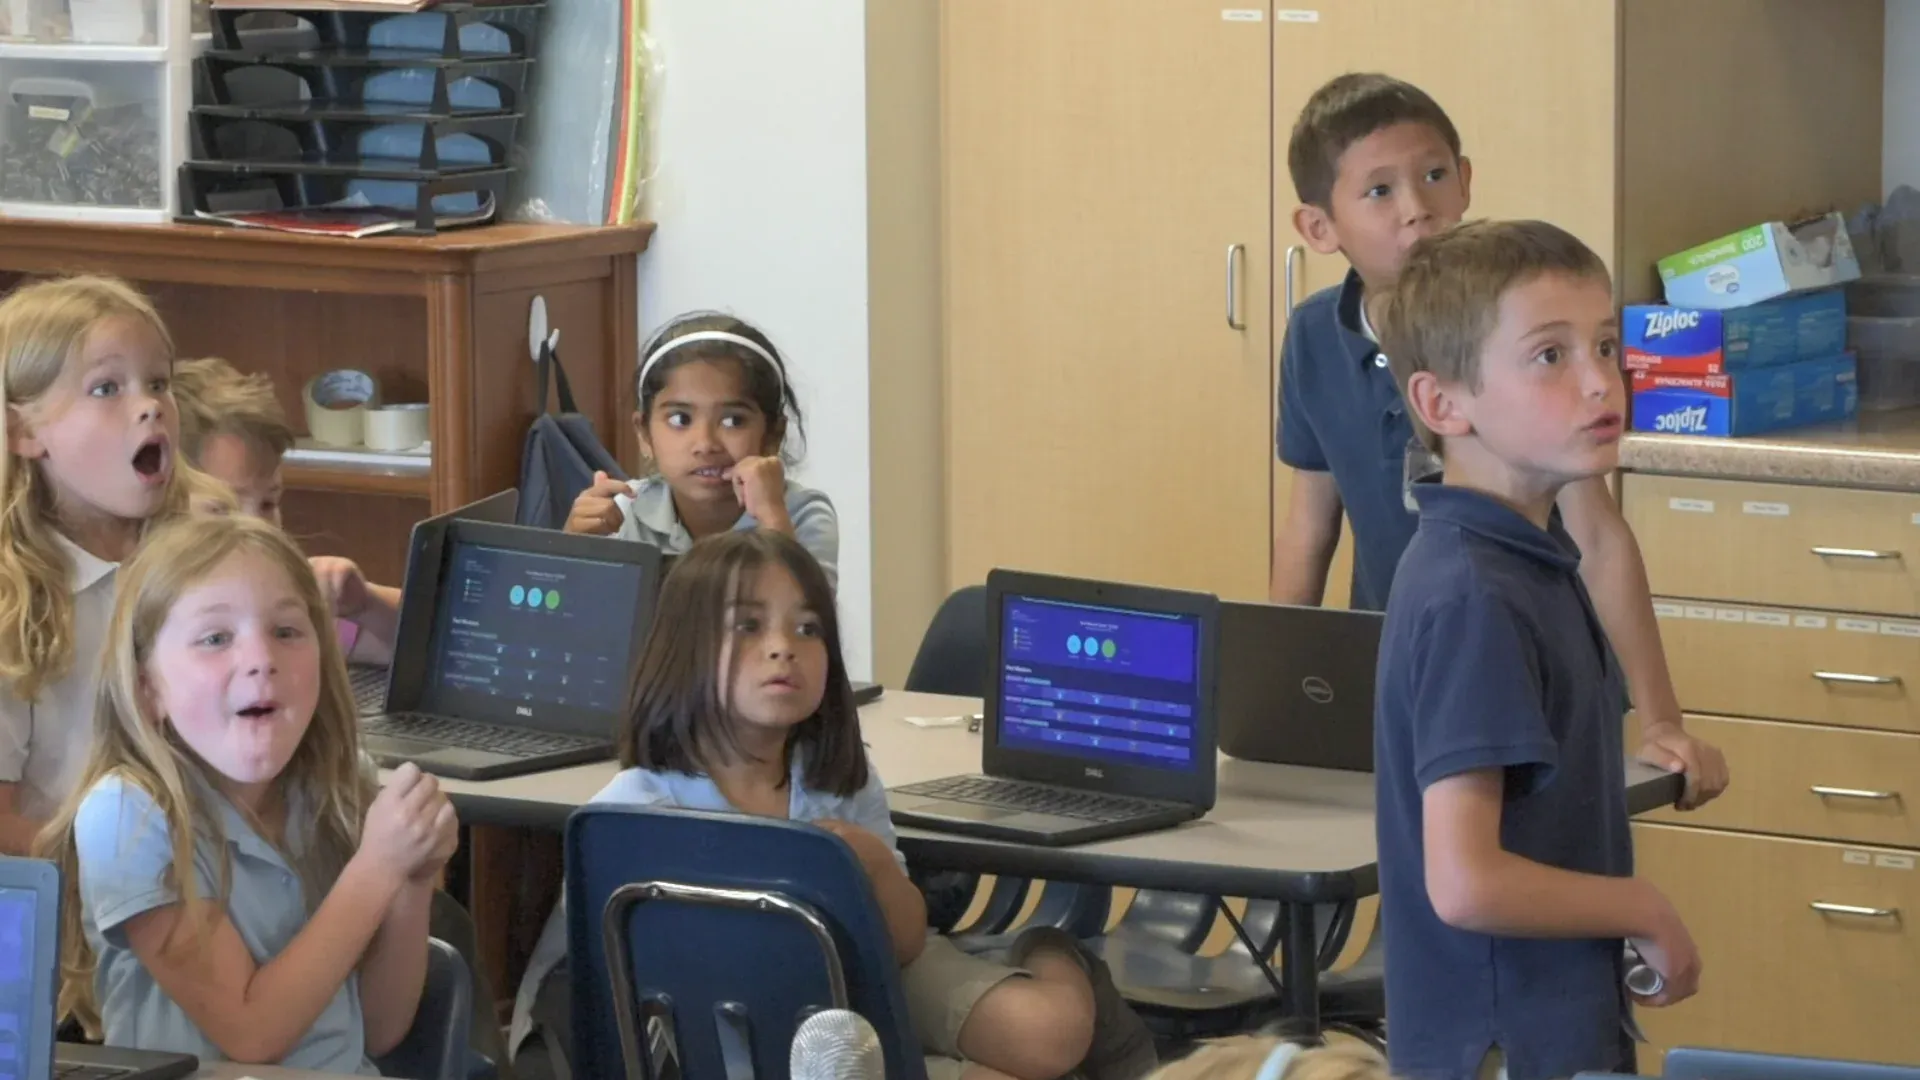
    Young students at a table of Chromebooks turn toward the front of the room, two of them open-mouthed, while two boys stand nearby watching the same way.
    A room of young students, mouths open, all looking the same way.

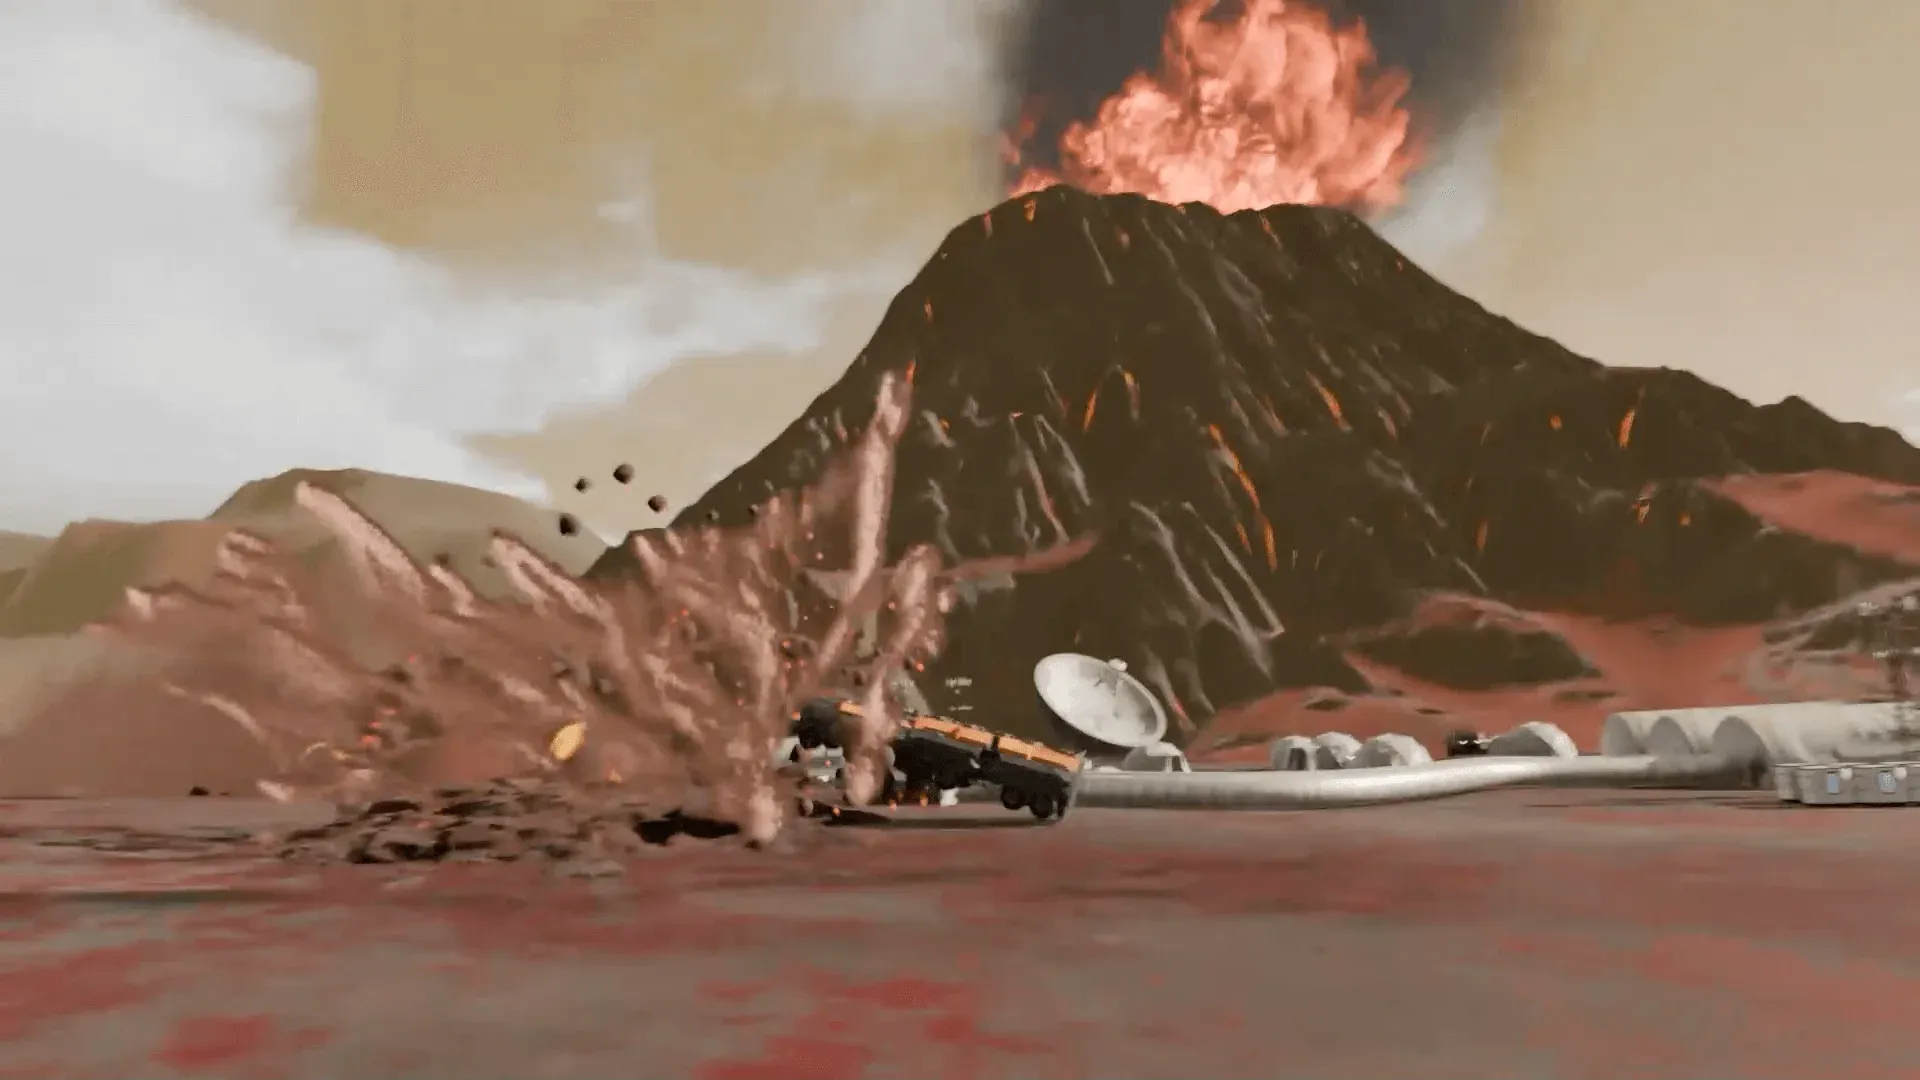
    Dug has built greenhouses on Areva, and he needs the crew’s help to plant his seeds correctly. The crew has to identify and model equivalent fractions, and those fractions decide how Dug plants the crops in each greenhouse. The story plays on the projector. The work happens at seven stations (Command, Engineering, Medical, Security, Science, I.T., Operations) and in the arguments between them.

    Every student is assigned to a team, and each team’s work is themed to it, from its own information and challenge to the same problem the rest of the crew is solving. The team gives a student a role in the story and people to lean on while you move between teams. You’re at the helm, asking what fraction of the bed this is, which other fraction is the same amount, and how they’d show it.

    It’s built to unit fractions (3.NF.A.1) and to equivalent fractions and comparing them (3.NF.A.3), and the vocabulary is the unit’s: equivalent, numerator, denominator, equal parts. It expects students who know what the numerator and the denominator mean and have made fraction models. Run the fraction strips first, and tell the class why: Dug’s greenhouses only get planted right by a crew that can see 1/2 and 2/4 are the same amount. The lesson prepares them. The Mission is what they’re preparing for.

    “Observe a mission in another classroom. It will change the way you think about them.”

    Danica Puente, Teacher, Holbrook Elementary, UT

    Will it work in my room?

    Students join with a class code: no student accounts, no student email, no passwords. Chromebooks, laptops, or tablets, plus your projector. Free for teachers, no credit card. Student data is covered by COPPA and FERPA, and we signed the Student Privacy Pledge. At about 28 minutes, Dug’s Great Big Garden fits inside the average 3 to 5 math block of about 63 minutes, with time left for the debrief.

    START FREE →

    Communication first, then two of the year's three

    What the report shows

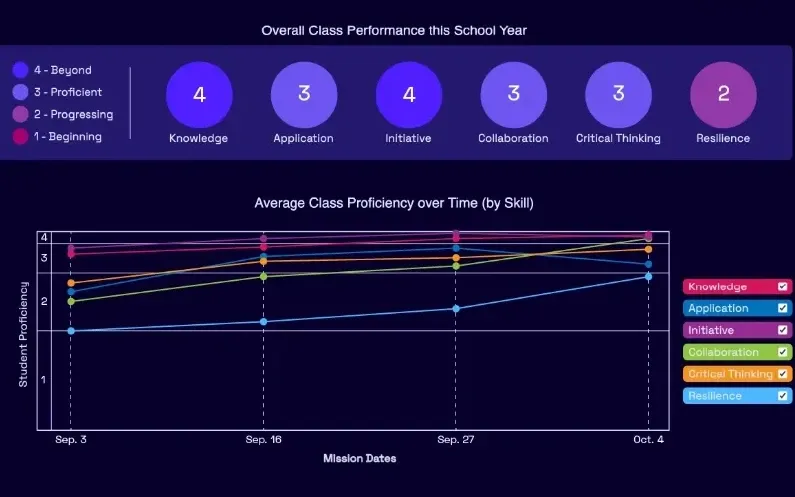
    A Mission.io class report: the class score in each of six skills, from knowledge and application to collaboration, critical thinking, and resilience, with the class chart across the year below.
    A class report from a real Mission: the class score in each of six skills, then each skill across the year.

    Every Mission produces a report for every student, built from what that student did across the whole Mission, on the skills the Mission captured. The six it can capture are Knowledge, Application, Initiative, Collaboration, Critical Thinking, and Resilience. The first two are what a test already sees. The other four are the human skills every school promises. The test shows what they know. The report shows the rest. SEE THE EVIDENCE →

    You taught it. Now find out who can use it.

    Who's behind it

    Mission.io is a research and design organization with one job: make collaborative, active learning something a teacher can run every unit instead of once a semester, and put a report in your hands when it’s over. Over a million students have run a Mission. The research behind them is funded by the National Science Foundation and the U.S. Department of Education’s Institute of Education Sciences, and Mission.io meets ESSA Level II standards, as validated by Instructure.

    3rd grade math standards and the Missions on them

    Twelve of the 25 3rd grade Common Core math standards, each with the Mission or the activity on this page that covers it. Nine have one of the year’s three Missions, numbered 7 to 9. Each code links to its standard on thecorestandards.org.

    Operations and algebraic thinking (3.OA)

    Multiplying and dividing within 100, the year’s biggest job. Collapse of Singularity City is built here, and The Crooked Snakes, under measurement and data, also carries 3.OA.C.7 and 3.OA.D.8.

    3rd grade operations and algebraic thinking standards, with the Mission and the activity on this page.
    NumberThe standardMissionMinutes
    73.OA.A.1, 3.OA.A.3, 3.OA.A.4 Read a product as equal groups, solve multiplying and dividing word problems within 100, and find the unknown number in an equationCollapse of Singularity CityOn this page: 2. Cereal arrays18

    Number and operations in fractions (3.NF)

    New this year, with unit fractions first. Dug’s Great Big Garden is built on it, and fraction strips teach the first standard.

    3rd grade fraction standards, with the Mission for unit and equivalent fractions.
    NumberThe standardMissionMinutes
    83.NF.A.1, 3.NF.A.3 Unit fractions and fractions built from them; equivalent fractions, and comparing fractions by sizeDug's Great Big GardenOn this page: 3. Fraction strips28

    Measurement and data (3.MD)

    Time, graphs, line plots, and area. The paper airplanes teach the line plot, and The Crooked Snakes is built on picture graphs, with adding within 1000 (3.NBT.A.2) in the same row.

    3rd grade measurement and data standards, with the Mission for graphs and the activities on this page.
    NumberThe standardMissionMinutes
    3.MD.A.1 Tell time to the minute, and solve problems with minutes elapsedOn this page: 4. The time scavenger hunt
    93.MD.B.3, 3.OA.A.1, 3.OA.A.3, 3.OA.C.7, 3.OA.D.8, 3.NBT.A.2 Scaled picture graphs and bar graphs, and the “how many more” problems they answer, with multiplying, two-step problems, and adding within 1000 along the wayThe Crooked SnakesOn this page: 5. The bar graph24
    3.MD.B.4 Measure to the half and quarter inch, and show the data on a line plotOn this page: 1. Paper airplanes
    3.MD.C.7 Connect area to multiplying and addingOn this page: 6. Area and perimeter with tiles
    START FREEMISSION BRIEF →

    Free teacher account, no card. Start with the Communication Mission, marked Start here in your library, then Dug’s Great Big Garden, The Crooked Snakes, or Collapse of Singularity City, each after its 5-minute Teacher Preview.

    Also at this grade

    The 2nd grade math activities and 4th grade math activities pages have the neighboring years’ activities and their Missions; the 3rd grade engineering activities page rebuilds the balloon car; and the 3rd grade problem solving activities page rebuilds the three-act math task.

Questions 3rd grade math teachers ask

Which of these fits a math block?

Grades 3 to 5 average about 63 minutes of math a day, and all three 3rd grade Missions fit inside it: Collapse of Singularity City at 18 minutes, The Crooked Snakes at 24, and Dug’s Great Big Garden at 28. The paper airplanes need 50, or the 45-minute cut.

Which 3rd grade math standards does this page teach?

Twelve of the 25 3rd grade Common Core math standards, in three domain tables: 3.OA, 3.NF, and 3.MD. Three Missions cover nine of them, from 3.OA.A.1, 3.NF.A.1, and 3.MD.B.3, with 3.NBT.A.2 in The Crooked Snakes’ row, and six are taught by an activity on this page.

Which 3rd grade Mission goes with which unit?

Each one follows an activity on this page: Collapse of Singularity City after the cereal arrays, Dug’s Great Big Garden after the fraction strips, and The Crooked Snakes after the bar graph. Collapse of Singularity City’s Mission Guide lists The Crooked Snakes as a follow-up, so those two run well in that order.

How do I grade a line plot fairly?

Grade the readings and the behaviors, not the longest flight. Is every X where the flight log says it should be, and can the Plotter show it? That’s one grade. The four-behavior tally over two or three activities is the other. A team whose plane barely flew and whose plot is exact did the math.

Is this aligned to my state's standards, not just Common Core?

Each Mission page lists its Common Core codes and the state sets it maps to. All three 3rd grade Missions also map to Texas (TEKS) and Florida (B.E.S.T.), and Collapse of Singularity City and The Crooked Snakes map to North Dakota’s math standards too.

The line plot the PE teacher asked for

Day one, a problem by hand with the sheet. Day two, Dug's Great Big Garden after the fraction strips, The Crooked Snakes after the bar graph, or Collapse of Singularity City after the cereal arrays, each with its 5-minute Teacher Preview. All free.