7th grade math activities

The carnival game rebuilt so 7th graders prove their booth makes money, five more activities by standard, a free printable, and the 7 standards the page teaches.

Who we are. Mission.io makes Missions: teacher-led, whole-class simulations where students use what they’re learning to work through a real scenario together.

Everything on this page works without us. The 7 standards this page teaches are at the end, free, with the two Missions that run at 7th grade. (One is Brace for Impact: 6th grade coordinates, reviewed with an asteroid mine headed for the town’s power plant. Most review doesn’t come with one.)

On this page

What 7th grade math looks like

Seventh grade math activities are problems where the class has to use the math to decide something, argue about whether the numbers are right, and leave each student answerable for a piece. This page teaches 7 of the grade’s 24 Common Core math standards, each with an activity, and carries the two Missions that run at 7th grade.

The year has four big jobs. Proportional relationships (7.RP). Operations with rational numbers, negatives included (7.NS), and linear equations. Scale drawings, constructions, and area, surface area, and volume (7.G). And drawing inferences about a population from a sample (7.SP), the same domain where probability models arrive for the first time.

You know the activity that usually stands in for probability: a spinner, a prize table, a booth made from a cardboard box, and a carnival day to end the unit. Everyone plays, and nobody asks whether the booth would have lost money. This version starts with that question, because the council turns down any booth that can’t show its math.

Six things that turn an exercise into math

In 2024, 28% of eighth graders scored at or above Proficient in math (NAEP). Seventh grade is the year before that test, and it’s crowded with new ideas: proportional relationships, negative rational numbers, and probability. How the class works on them counts, because cooperative learning beat whole-class instruction on achievement, and the effect was stronger in science and math than in social sciences and languages, and stronger in elementary grades than in middle and high school (Kyndt and colleagues, 2013).

  1. 1. A real problem with stakes the class can feel.

    “Find the probability” is an exercise. “The council cuts any booth that loses money, and any booth nobody wins” is a problem.

  2. 2. Apply, don't recall.

    A second round that only works with the data from the first. If the booth can be approved without the model, it isn’t a math activity.

  3. 3. Group goals with individual accountability.

    The one most carnival projects miss: one kid builds the booth, one kid does the math. When the group shared a goal and each student answered for a part, 84% of studies found a positive effect; without both, 17% (Slavin, 1991).

  4. 4. The teacher leads the thinking.

    Three questions at the booth (what does your model say the win rate is, what did 40 trials show, which number changes if the council calls you too generous) beat a worksheet of twenty at the desk.

  5. 5. A debrief where the class argues it out.

    The carnival is the setup. The argument afterward, about why the trials and the model disagree, is the practice the standards name: construct viable arguments and critique the reasoning of others (MP3).

  6. 6. A way to see who did what.

    If you can’t tell which student built the model and which one built the booth, you can’t teach probability. You can only grade the booth.

Luck runs the booth. Math decides if it opens.

The sheet at the end of the next section has the model box, the 40-play tally, the prize table, and the council proposal, with a worked example for you. Get the sheet →

The carnival game, rebuilt for 7th grade (7.SP.C.7)

Teams design a game of chance (a spinner, dice, or a cup draw), compute the theoretical probability of winning, run trials, compare them to the prediction, and set a prize structure so the booth makes money. It’s the probability project on nearly every 7th grade list, because 7th grade is the first time probability is a standard (7.SP.C), and a booth that loses money is the first time a probability has a consequence. The way it usually runs, one kid builds the booth, one kid does the math, and the carnival day is the end. Here’s the version that hits all six.

Time
Two periods for a built booth. The 45-minute cut: pre-made devices on a tray (spinners, dice, a cup of colored cubes), so design means choosing a device and a win condition; 30 trials instead of 40; and the proposal written in the last ten minutes.
Groups
Fours. With 30 students, seven groups of four and one of two, where the Model Lead also keeps the accounts.
Supplies
Paper spinners (print them, plus a paper clip), dice, cups and cubes, and the proposal sheet. About $5.
Standards
7.SP.C.7 (build a probability model, compare it to observed frequencies, and explain the gap), with 7.SP.C.6 (estimate a probability from long-run relative frequency), and the practices MP4 (model with mathematics) and MP3 (construct viable arguments).
  1. Teach first, 10 minutesApply

    Spin a four-color spinner 20 times on the board and tally. If red comes up 7 times when the model says 5, ask why. Name the two ideas: the model (what should happen, from the spinner’s parts) and the observed frequency (what did happen), and that the two get closer with more trials. Then name the booth rule: a game that wins too often loses money, and a game that never wins loses customers.

  2. The problemStakes

    The student council carnival needs booths that raise money for the 8th grade trip, and the council will only approve a game whose owner can show the math: the probability of winning, the prize cost, and the expected take over 100 plays. A booth that loses money is cut. So is a booth nobody wins: the council’s floor is at least 1 in 5 plays winning something. The team’s job is a one-page booth proposal with a model, trial data, and a prize plan. Say the stakes out loud: the math decides which booths open.

  3. Four roles, one job eachAccountability

    On the sheet, and everyone signs their role’s box.

    • Game Designer

      Builds the chance device, and is the only pair of hands on it during trials.

    • Model Lead

      Computes the theoretical probability of each outcome from the device's parts, and signs it.

    • Trial Runner

      Runs 40 fair plays and calls each outcome aloud.

    • Accountant

      Tallies the trials, compares them to the model, sets the prize values, and works out the expected take per 100 plays.

  4. You lead the thinkingTeacher leads

    Three questions, asked at the booth: What does your model say the win rate is, and which parts of the device make it so? What did 40 trials show, and why might that differ from the model? If the council says your game is too generous, which number do you change? The hardest part is not telling them the trials are wrong. Sometimes it’s the device.

  5. Two rounds, so the first answer has to be rightApply

    Round one: the first design, the model, 40 trials, and the comparison. Round two: the team changes one thing (the device, the win condition, or the prize) to meet the council’s rules, and reruns 40 trials. The Trial Runner and the Game Designer swap.

  6. The debrief, 12 minutesDebrief

    Every team’s model-versus-observed on the board. Which teams’ observed rates came closest to the model, and did anyone’s 40 trials mislead them? Where did the biggest gap come from: a biased device, too few trials, or a wrong model? Which booth makes the most per 100 plays while meeting the 1-in-5 floor, and what’s the evidence? Who on your team changed the game to fix the math, and what did they change? The second question is the standard (7.SP.C.7), asked out loud.

  7. See who did whatSee who did what

    The observation sheet, four behaviors per student: computed a probability from a model, explained a discrepancy with a reason, argued with data, changed their mind with a reason. The trial phase is loud and quick, so tally during the model and proposal phases; you’ll catch about half the room.

(The booths are raising money for the 8th grade trip. Say so during round two, and watch the prize values shrink.)

If your school runs a real carnival, the proposal that clears the council and earns the most per 100 plays is ready to hand in.

The carnival game booth, free

Emailed now, ready to copy: the teacher page, the Game Designer, Model Lead, Trial Runner, and Accountant role cards, the model box with the 40-play tally (one for each round), the prize and expected-take table with the council proposal, a worked example, and the four-behavior tally.

It’s on its way.

Check your inbox for the carnival game booth.

Email me the sheet. It comes as a PDF, ready to print. Unsubscribe anytime.

Five more 7th grade math activities, by standard

Five more on every 7th grade list: what each one is, how it usually runs, and what it needs to be a math activity, in the order the standards run.

Proportions, percents, integers, scale, sampling

2. Proportional lemonade or recipe scaling (7.RP.A.2)

Needs recipe cards or lemonade ratios.

Students scale a recipe or a lemonade mix up and down, find the unit rate, and check whether each version keeps the same ratio. In 7th grade it runs as proportional reasoning practice, and the scaling is real math. As usually run, though, it’s a worksheet with nothing riding on the answer, and nothing shows who could tell a proportional mix from one that only looks close.

The fix

  1. Give the group four jobs, the way the 6th grade lemonade does, a Mixer, a Table Builder, a Line Drawer, and a Scaler, each signing their part.
  2. Run two rounds, and add a recipe written as a unit rate in round two, so the first round’s method has to hold up.
  3. Make the answer go on a sign that ranks the recipes and gives the big batch amount, so a wrong ratio means the sign lies.
See the lemonade rebuilt for 6th grade →

3. Percent shopping with discounts and tax (7.RP.A.3)

Needs a store flyer or price list, and a tax rate. Individual, usually.

Students work through a store flyer with a shopping list: take 25% off the jacket, add the sales tax, and find what the list really costs. It already has a real problem and real percent math, the kind adults do at the checkout. As usually run, though, it’s a solo worksheet, and a final total can’t tell you who found 25% of the price and who subtracted 25 dollars.

The fix

  1. Work in pairs: one finds each sale price and the tax, and the other checks it a second way, like multiplying by 0.75.
  2. Have each student total half the list and sign it.

No page for this one; the two misses are the fix.

4. Integer football or card games (7.NS.A.1)

Needs a deck of cards or a game board.

Students add and subtract integers to move a ball up and down a football field, a gain of 7, a loss of 12, or play a card game where red cards are negative and black cards are positive. The games keep the reps coming. As usually run, though, it’s a drill game with nothing to figure out beyond the next move, and you can’t tell who understands why subtracting a negative moves the ball forward.

The fix

  1. Pair students: one makes the move, and the other writes it as an equation, like 3 - (-5) = 8, and checks it before the ball moves.
  2. Have each student write two moves from the game on an exit card with their name.

No page for this one; the three misses are the fix.

5. A scale drawing of the classroom (7.G.A.1)

Needs tape measures, rulers, graph paper. Individual, usually.

Students measure the classroom with tape measures and draw it on graph paper to scale, one square for a foot, desks and doors included. The scale gets real use, and a door that comes out wider than the wall shows the mistake fast. As usually run, though, it’s a solo project, and a finished drawing can’t tell you who measured, who scaled, and who traced.

The fix

  1. Work in groups of four, where the Measurer takes each length and says it aloud.
  2. The Scaler converts it with the scale, and the Drafter is the only pencil on the drawing.
  3. The Checker measures two things on the drawing, converts them back, and compares them to the room before the group signs off.

No page for this one; the four roles are the fix.

6. M&M or Skittles sampling (7.SP.A.2)

Needs a bag of candies per group, and cups for the samples.

Groups pull small samples from a bag of M&Ms or Skittles, record the colors, and use the samples to estimate the color mix of the whole bag. The sampling is honest, and different samples give different answers, which is the point of the standard. As usually run, though, it’s a snack with nothing riding on the estimate, and the candy is gone before anyone has to stand behind a number.

The fix

  1. The Sampler draws each sample and hands it over without looking.
  2. The Recorder writes every sample’s colors in a table.
  3. The group writes a claim about the whole bag, like a third of the bag is red, and defends it to the class before anyone counts the whole bag.

No page for this one; the claim is the fix.

  • Our part · We make Missions

    Then the unit has somewhere to go

    Plenty of teachers rebuild these by hand every unit, and it works. A Mission is a teacher-led, whole-class simulation built from a unit you teach. The carnival is probability (7.SP.C.7), and no Mission carries a 7th grade code. Brace for Impact runs on negative coordinates and distance, the same number sense the integer game builds. After the integer game, run Brace for Impact.

    You're at the helm, not on the hook.

    Brace for Impact: the coordinate plane, as a Mission

    Brace for Impact · Grades 6 to 8 · About 30 minutes · One device per student, plus your projector · Free with a teacher account

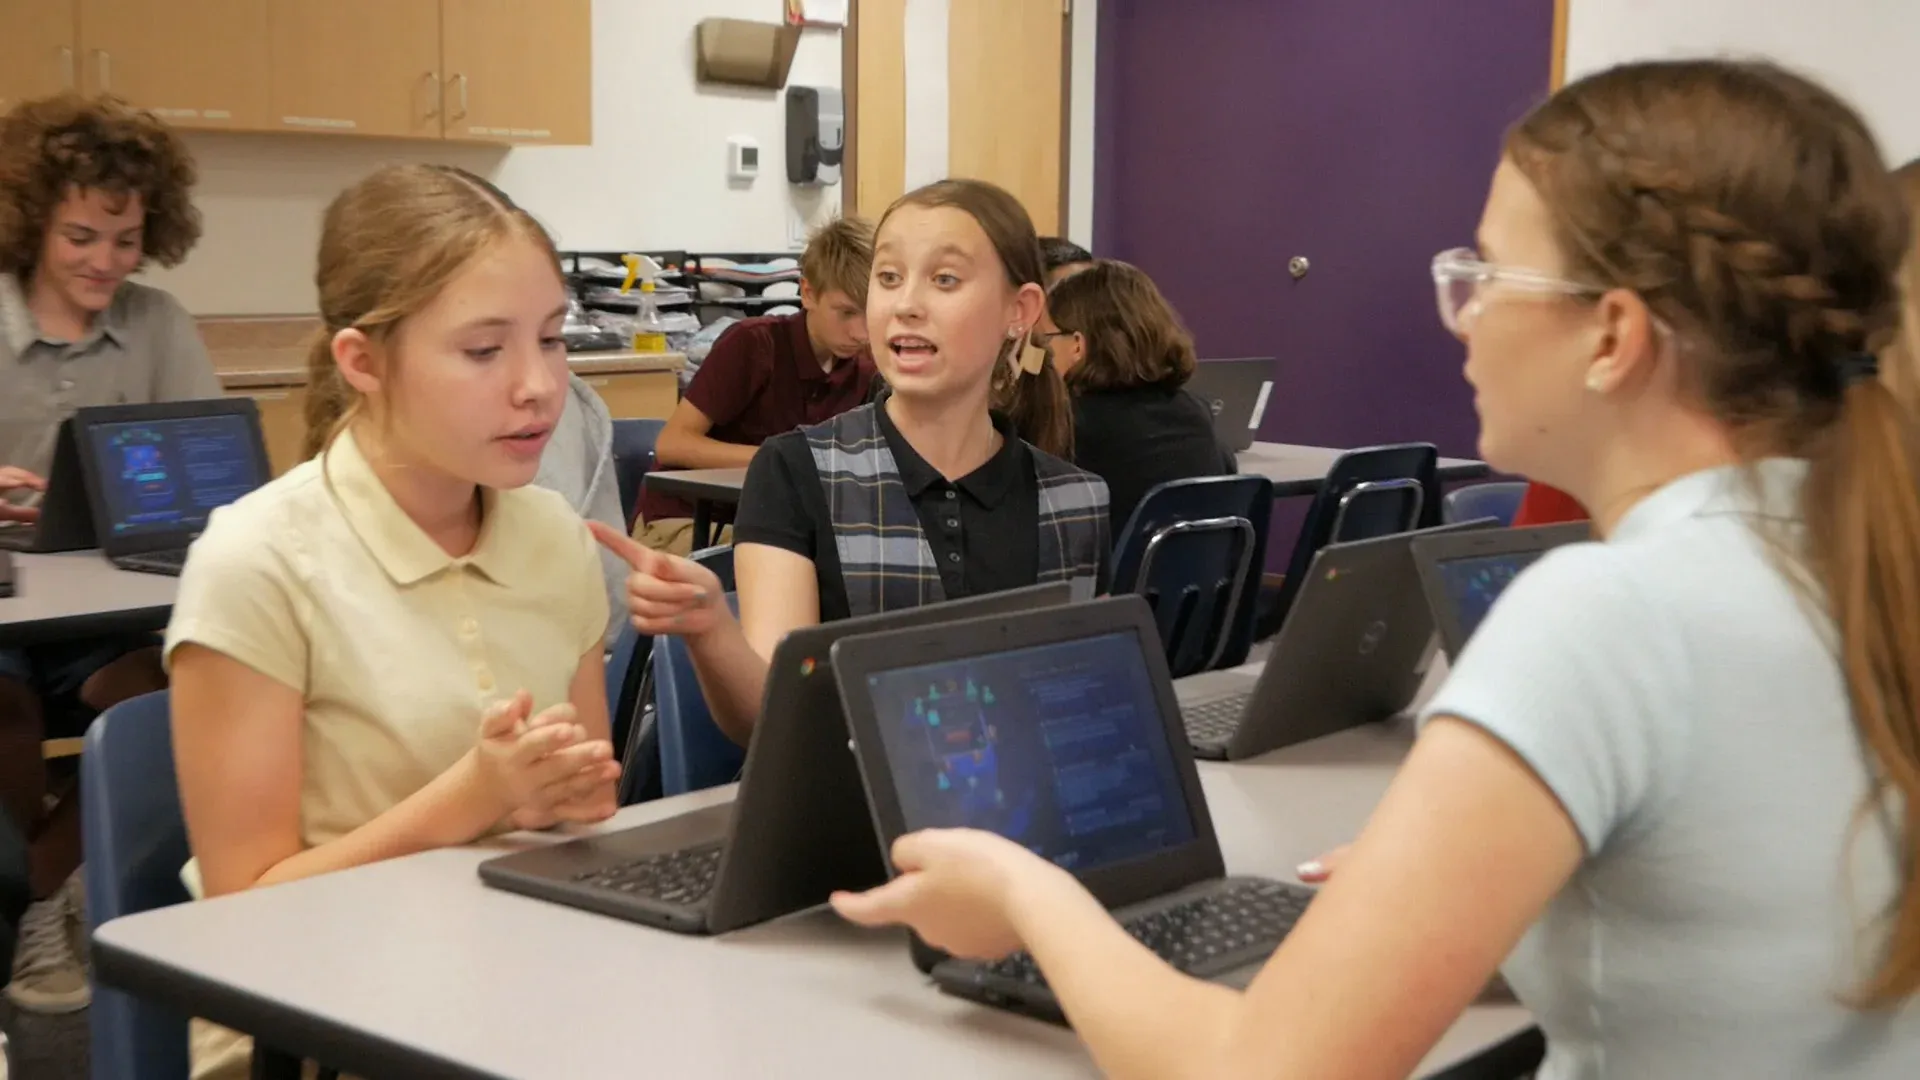
    Three middle school students at Chromebooks talk across their table; one gestures while the other two listen.
    Three students talking it through across their table.

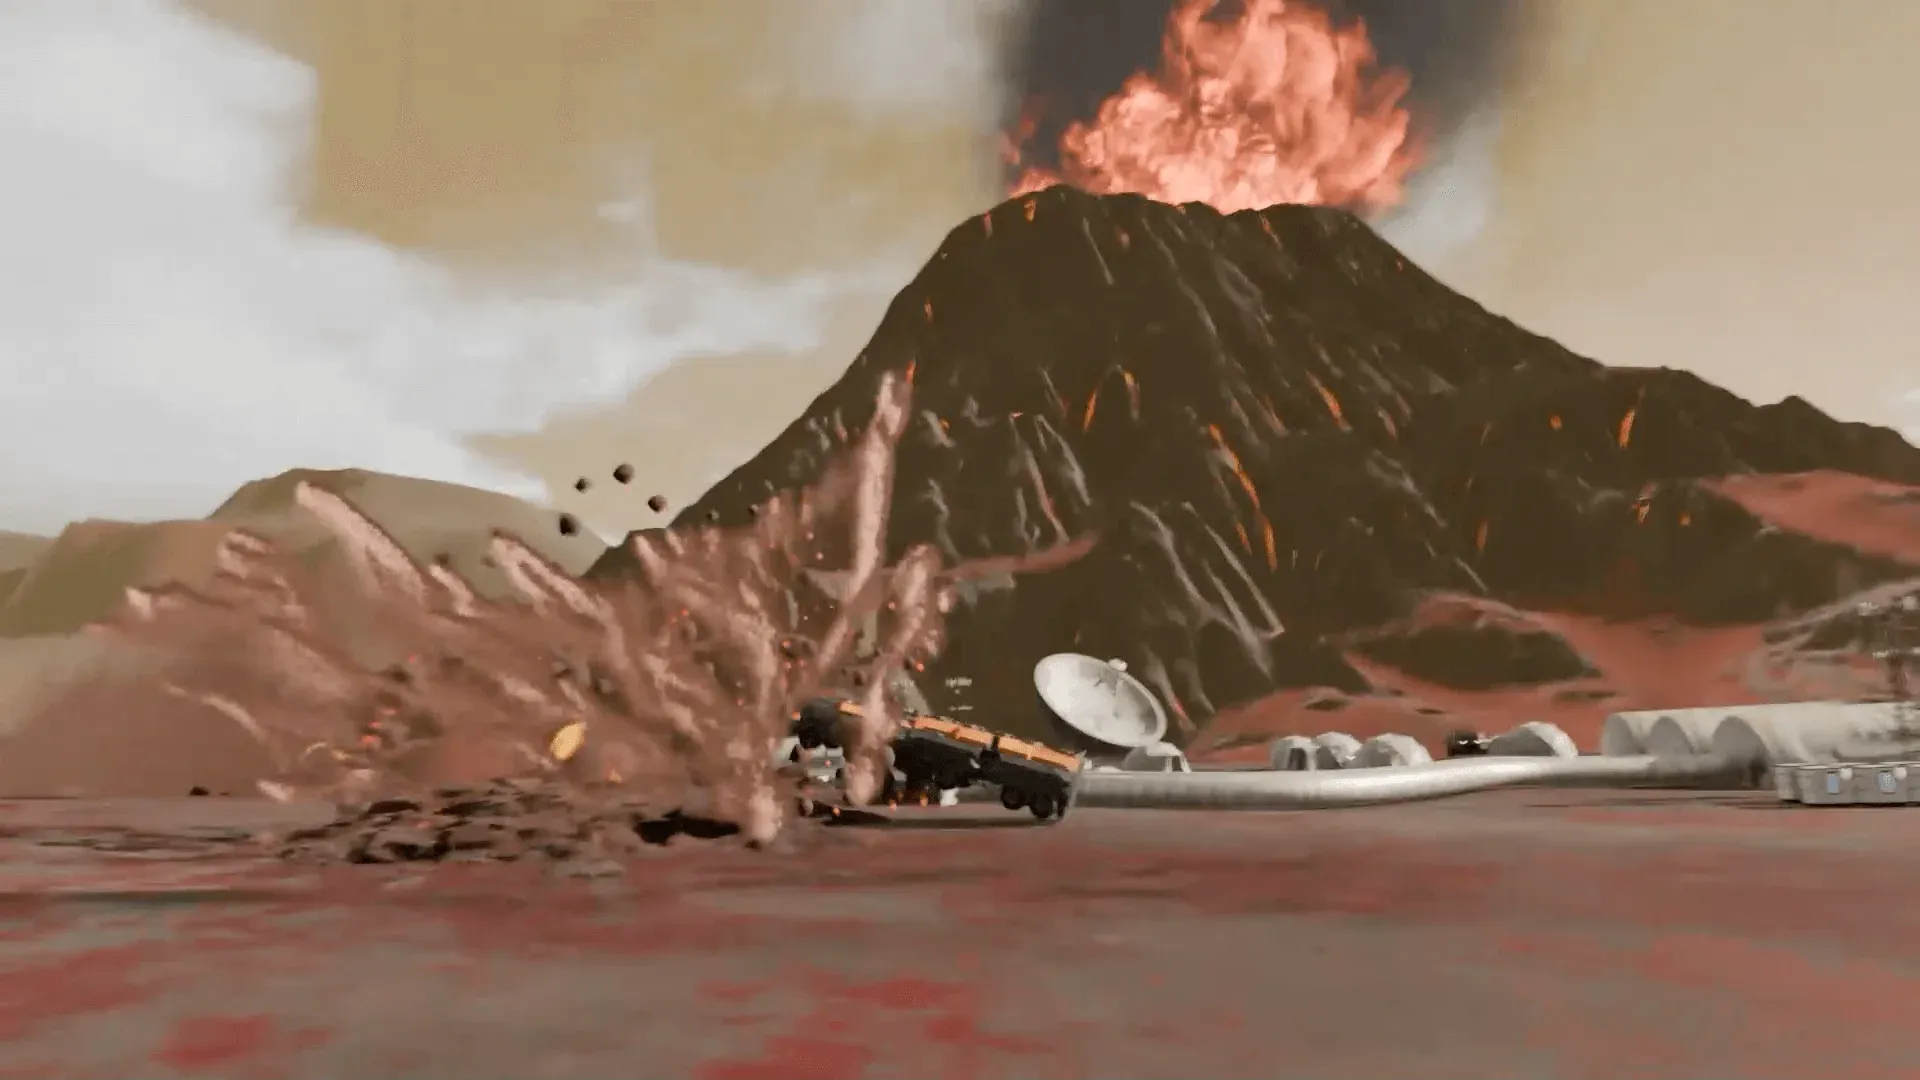
    An abandoned asteroid mine is on course for the town’s power plant, and if nobody stops it, the damage will be massive. The crew has to use the coordinate plane to work out the best course of action and head off the outages and the disaster. The story plays on the projector. The work happens at seven stations (Command, Engineering, Medical, Security, Science, I.T., Operations) and in the arguments between them.

    Every student is assigned to a team, and each team’s work is themed to it, from its own information and challenge to the same problem the rest of the crew is solving. The team gives a student a role in the story and people to lean on while you move between teams. You’re at the helm, asking what the coordinates are, what the distance is, and how they know.

    It’s built to a 6th grade standard, 6.NS.C.8: points in all four quadrants, and distances between points along a grid line. The vocabulary is the plane’s: x-axis, y-axis, coordinate grid, ordered pair, x-coordinate, y-coordinate. For 7th graders it’s review with stakes, and the distance work is the same absolute value idea 7.NS.A.1 uses on the number line. Run the integer game first, and tell the class why: the mine only gets stopped by a crew that’s quick with negative coordinates. The lesson prepares them. The Mission is what they’re preparing for.

    “Even my quiet or reluctant students participate because the missions are structured in a way where everyone’s voice matters.”

    Adriana Lopez, Junior high teacher, Clint Jr. High School

    Will it work in my room?

    Students join with a class code: no student accounts, no student email, no passwords. Chromebooks, laptops, or tablets, plus your projector. Free for teachers, no credit card. Student data is covered by COPPA and FERPA, and we signed the Student Privacy Pledge. At about 30 minutes, Brace for Impact fits inside a 45-minute period with time left for the debrief.

    START FREE →

    Communication first, then the two at 7th grade

    What the report shows

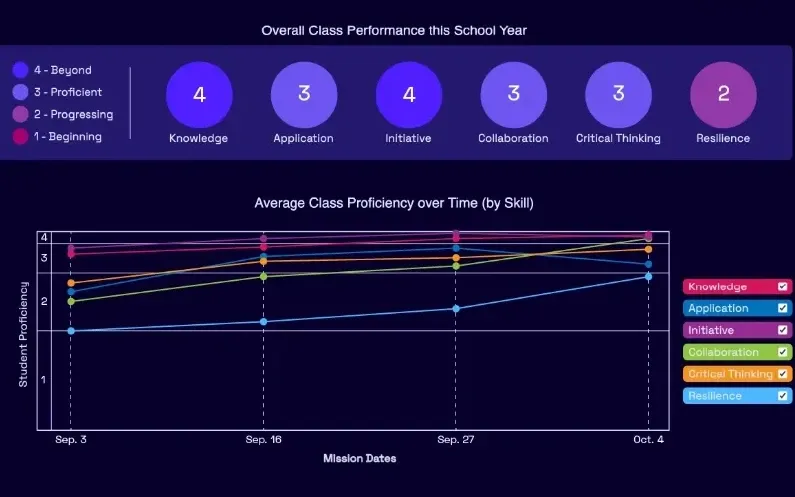
    A Mission.io class report: the class score in each of six skills, from knowledge and application to collaboration, critical thinking, and resilience, with the class chart across the year below.
    A class report from a real Mission: the class score in each of six skills, then each skill across the year.

    Every Mission produces a report for every student, built from what that student did across the whole Mission, on the skills the Mission captured. The six it can capture are Knowledge, Application, Initiative, Collaboration, Critical Thinking, and Resilience. The first two are what a test already sees. The other four are the human skills every school promises. The test shows what they know. The report shows the rest. SEE THE EVIDENCE →

    You taught it. Now find out who can use it.

    Who's behind it

    Mission.io is a research and design organization with one job: make collaborative, active learning something a teacher can run every unit instead of once a semester, and put a report in your hands when it’s over. Over a million students have run a Mission. The research behind them is funded by the National Science Foundation and the U.S. Department of Education’s Institute of Education Sciences, and Mission.io meets ESSA Level II standards, as validated by Instructure.

    7th grade math standards, plus two 6th grade Missions

    Below are 7 of the 24 7th grade Common Core math standards, each with the activity on this page that covers it. No Mission carries a 7th grade code, so the 2 that run at 7th grade come first, numbered 7 and 8, on their 6th grade codes. Each code links to thecorestandards.org.

    Also at 7th grade, on another grade's standards

    Both run at 7th grade and are built to 6th grade codes. Run them as review with stakes, and tell the class that’s what they are.

    Missions that run at 7th grade on 6th grade Common Core math codes.
    NumberThe standardMissionMinutes
    76.NS.C.8 Graph points in all four quadrants, and find distances along a grid line (grades 6 to 8; a 6th grade code)Brace for Impact30
    86.G.A.1 Area of polygons by composing and decomposing, the 6th grade work under 7.G.B.6 (grades 6 to 9; a 6th grade code)Infection34

    Ratios and proportional relationships (7.RP)

    Proportional relationships and percents. Two activities above teach them.

    7th grade ratio and proportion standards, with the activities on this page for the ones they teach.
    NumberThe standardMissionMinutes
    7.RP.A.2 Recognize and represent proportional relationshipsOn this page: 2. Proportional lemonade
    7.RP.A.3 Multistep ratio and percent problems: tax, markups and markdowns, interest, percent errorOn this page: 3. Percent shopping

    The number system (7.NS)

    Adding and subtracting rational numbers, negatives included. The integer game teaches it.

    7th grade number system standards, with the activity on this page for adding and subtracting.
    NumberThe standardMissionMinutes
    7.NS.A.1 Add and subtract rational numbers, on a number lineOn this page: 4. The integer game

    Geometry (7.G)

    Scale drawings, and redrawing them at a new scale. The classroom scale drawing teaches it.

    7th grade geometry standards, with the activity on this page for scale drawings.
    NumberThe standardMissionMinutes
    7.G.A.1 Scale drawings: actual lengths and areas, and redrawing at a new scaleOn this page: 5. The scale drawing

    Statistics and probability (7.SP)

    Inference from samples, and probability models, new this year. The carnival and the sampling bag teach them.

    7th grade statistics and probability standards, with the activities on this page for the ones they teach.
    NumberThe standardMissionMinutes
    7.SP.A.2 Draw inferences from random samples, and gauge how far off they might beOn this page: 6. Sampling
    7.SP.C.6 Estimate a probability from long-run relative frequencyOn this page: 1. The carnival
    7.SP.C.7 Build a probability model, and compare it to what happenedOn this page: 1. The carnival
    START FREEMISSION BRIEF →

    Free teacher account, no card. Start with the Communication Mission, marked Start here in your library, then Brace for Impact or Infection, each after its 5-minute Teacher Preview.

    Also at this grade

    The 6th grade math activities page rebuilds the lemonade and teaches the 6th grade standards these two Missions are built on; the 8th grade math activities page is the year after. The 7th grade problem solving activities page rebuilds Fermi problems, with Laser Labyrinth as its Mission, and the 7th grade STEM activities page rebuilds the paper roller coaster and lists every 7th grade Mission by subject.

Questions 7th grade math teachers ask

Which of these fits a 45-minute period?

Both Missions that run at 7th grade do: Brace for Impact at 30 minutes and Infection at 34. The carnival takes two periods for a built booth, or the 45-minute cut with pre-made devices and 30 trials.

Which 7th grade math standards does this page teach?

Seven of the grade’s 24 Common Core math standards, across four domains: 7.RP, 7.NS, 7.G, and 7.SP. Each is taught by an activity on this page, the carnival’s 7.SP.C.7 among them. The two Missions that run at 7th grade come first, on 6th grade codes.

Which Missions can a 7th grade class run?

Two, both on 6th grade codes, and this page doesn’t pad the count. They work as review with stakes: Brace for Impact on the four-quadrant plane, and Infection on the area of polygons. The 7th grade problem solving activities page carries Laser Labyrinth, which runs grades 5 to 8.

How do I grade the carnival fairly?

Grade the model and the behaviors, not the best-looking booth. The proposal is one grade: is the model right, do the trials back it up, and does the prize plan meet the council’s rules? The four-behavior tally over two or three activities is the other. A booth that passed by luck has a model that doesn’t match its trials, and that’s a question for the debrief.

Is this aligned to my state's standards, not just Common Core?

Each Mission page lists its Common Core codes and the state sets it maps to. Brace for Impact also maps to Texas (TEKS), Florida (B.E.S.T.), and North Dakota’s math standards.

A carnival booth that has to show its odds

Day one, a problem by hand with the sheet. Day two, Brace for Impact after the integer game, or Infection when the unit is area. Watch the 5-minute Teacher Preview before either; all of it is free.